Innovation Insights is an intelligence practice with two lenses. One scans the world outside: 26 industry verticals, daily, enriched through our InnoGraph. The other listens to the world inside: your organization's relational dynamics and hidden patterns. Then we score where those signals converge, and bring your team into thinking rooms designed to turn those convergences into the strategic questions nobody in the room knew they needed to ask.
Every day the InnoGraph scans two dozen industries and scores where the signals collide. Point at a sector, tap a blip, and read the raw signal underneath.
Our core IP is a knowledge graph where innovation trends and catalysts are first-class citizens. Patterns like scaling, distributed, autonomous exist as traversable nodes—not buried metadata. Constraints and capabilities chain together, revealing connections that traditional scanning misses.
Every day we scan 26 industry verticals for funding rounds, product launches, strategic pivots, market shifts, and new business models. Every signal comes from curated sources, drawn from the most trustworthy parts of the open web: academic, corporate, think tank, and startup. Each one is filtered, enriched, and woven into the graph. The result is an intelligence layer that's emergent but evidenced. Living and traceable. Transparent.
All companies, despite formal org charts, have indirect and less obvious ways of "getting things done". These informal influence pathways are made visible through a tool called 'organizational network analysis' or ONA.
Along with mapping innovation signals, we love to help our clients construct maps of these hidden pathways in your organization or your ecosystem. Innovation thrives on free and diverse information exchange and serendipitous connections making. These are attributes that, if visualized, can be designed and optimized for. See how trust/information/decisions actually flow (or not) through your system. Used in tandem with our Jedi games, you get innovation AND serendipitous connection making 'on the fly'.
We are fellows in the Social Fabrics Lab of Dr. Silvia Fierăscu, with whom we co-created SynthONA, an open synthetic data benchmark protocol for organizational network design, shared on Harvard's Dataverse. Thanks to our Jedi Signals engine, we were able to shape the taxonomy and personae behind the SynthONA attribute model.
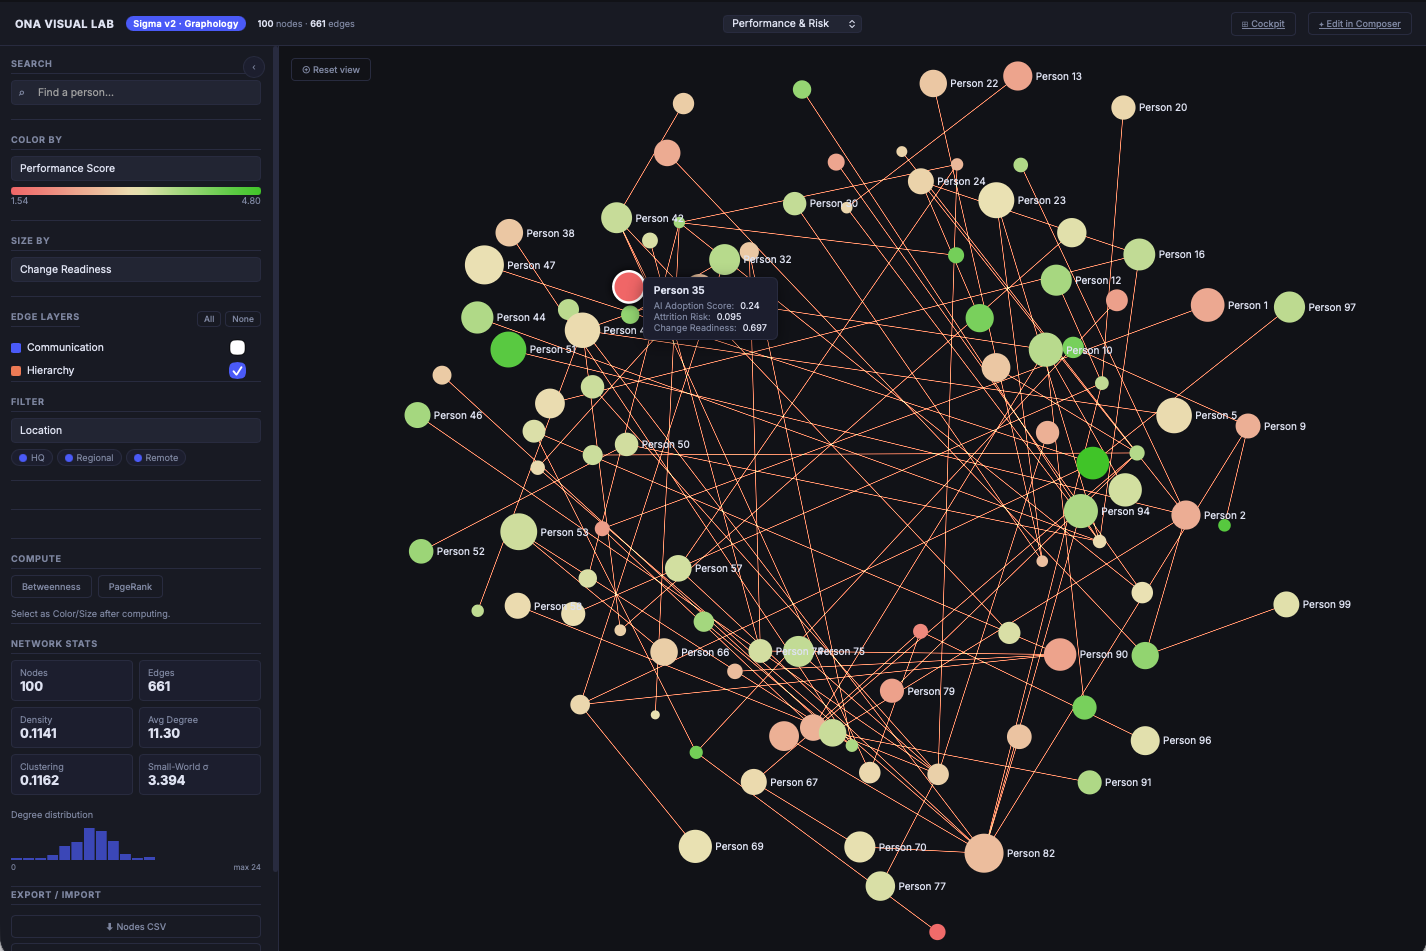
Synthetic ONA model: 100 nodes, 661 edges. Node size = Change Readiness. Color = Performance Score. Each node carries AI Adoption Score and Attrition Risk. Generated with SynthONA, an open organizational-network benchmark protocol published on Harvard Dataverse (DOI 10.7910/DVN/PP5UNG), co-developed by Curtis Michelson as a fellow of the Social Fabrics Research Lab.
When we say we "smash signals together," what we mean is we are continuously scanning thousands of signals across layers (application, catalyst, technology, trend) and from trade, research and think tank sources, in order to surface the timely moments when unrelated domains begin exhibiting similar structural patterns.
Each collision is scored across five dimensions: signal density, cross-layer spread, thematic clustering, incumbent involvement, and acceleration rate. A score of 9 or 10 out of 11 means something real is moving. Generative AI + 3D Model Generation + Creative AI at 10/11. Cancer & Oncology + Biomarkers + Antibody-Drug Conjugates at 9/11. These aren't keyword matches — they're structural convergences, surfaced this week, from credible real-world sources.
Frontier science meets business strategy. A bi-weekly speculative fiction suggesting the shape of things to come.
This fortnight brought 1,436 signals across corporate, startup, thinktank, and research sources into focus, and the throughline is <strong>the AI story is leaving the screen and colliding with the physical, human world</strong>. A Gallup poll found 71% of Americans don't want a data center near them — more opposition than nuclear plants draw — while the electricity demand behind those centers now exceeds any surge since the 1950s air-conditioning boom. Autonomous excavators and dozers started working real jobsites, a Swiss retrofit startup raised $200M from SoftBank to make any machine driverless, and Waymo shipped custom silicon built for the road. The store quietly became a media company: Walmart's ad business grew 38%, Target's profit doubled on Roundel, and both named Chief AI Officers. AI learned to read the body — skin analysis in 4,000 beauty stores, GLP-1 nutrition, wedding-ecosystem matchmaking — while hospitals put inference into the exam room at Epic, Mayo, and Ping An. Underneath the optimism, two anxieties surfaced: enterprises admitting they can't stop a runaway agent's spending, and China quietly catching up across chips, robot dogs, cars, and music. Fifteen fortnights in, the pattern isn't AI in the cloud anymore. It's AI in the neighborhood, on the jobsite, in the mirror, and in the exam room — and the friction that comes when software finally touches the ground.
Read This EditionSome convergences are best understood by living them. When Innovation Insights surfaces patterns around value creation and ecosystem dynamics, the Value Network Game brings those abstractions to life. Your team experiences competitive shifts before they hit the P&L.
Explore Our GamesWe'll pull the live convergences scoring highest in your verticals right now and walk your leadership team through the strategic questions they should be asking before those patterns become obvious to everyone.
Book a Signal Pattern Briefing